


Introduction
So, you've deployed Tetragon and you're seeing the kernel-level security events it produces. You can see every process execution, every network connection, every file access.
This is a goldmine of security data. But it immediately leads to the next big question: where do you put it all?
A stream of raw JSON logs is only useful if you can effectively collect, route, and analyze it at scale.
This is where a modern observability pipeline comes in. In this article, I'll walk you through my hands-on experience building a powerful, open-source solution for centralizing your Tetragon logs. We'll use Vector to ship our security findings directly into Amazon CloudWatch.
Part 1: What is Tetragon? (A Quick Recap)
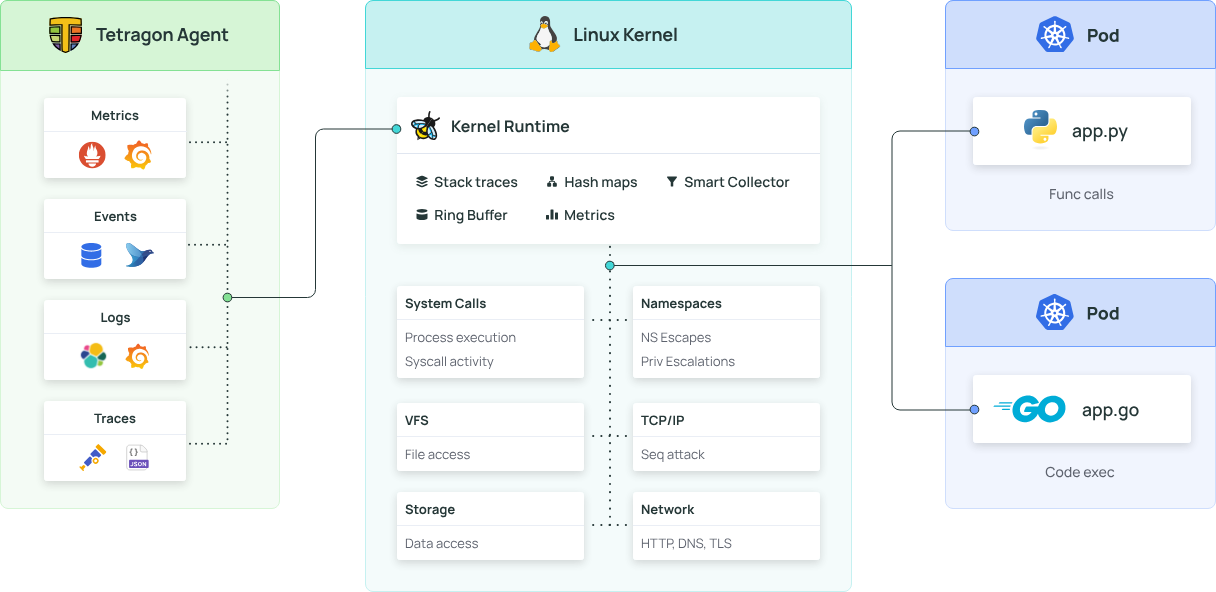
For those new to the topic, Tetragon is an open-source security observability and runtime enforcement tool that uses eBPF. Developed by the team behind Cilium, it acts like a high-speed security camera running inside the Linux kernel of every node in your cluster. This gives it incredibly deep visibility into your workloads without the overhead of sidecars or language-specific agents.
Part 2: The Missing Piece - What is Vector?
Tetragon produces the data. Vector is what sends the data. Vector is a high-performance, open-source observability data pipeline. Think of it as a "logistics hub" for all your logs, metrics, and traces. Its job is to:
- Collect data from various sources (like Tetragon).
- Transform it by parsing, enriching, or filtering.
- Route it to dozens of different destinations (sinks).
We're using it because it's incredibly fast, memory-efficient, and gives us the flexibility to change our minds later without re-architecting everything.
Part 3: The Hands-On Guide
Let's get to the practical part. Here’s how to install Tetragon and build the pipeline.
Step 1: Installing Tetragon
First, we need to get Tetragon running. It runs as a Kubernetes DaemonSet, which is a workload that ensures a copy of the agent pod is running on every single node in your cluster. This is perfect for cluster-wide visibility.
The installation is a few simple Helm commands:
# Add the Cilium Helm repository
helm repo add cilium https://helm.cilium.io/

# Create a dedicated namespace for Tetragon
kubectl create namespace tetragon

# Install Tetragon into its namespace
helm install tetragon cilium/tetragon -n tetragon
After a minute, you can verify that the Tetragon pods are running on each of your nodes with the command: kubectl get pods -n tetragon. By default, Tetragon will now be writing its security events to a log file at /var/run/cilium/tetragon/tetragon.log on each node.
Step 2: Prepare AWS Credentials for Vector
Before Vector can send logs to CloudWatch, we need to give it permission. This involves three main tasks in AWS:
- Create an IAM Policy: Define a policy that grants permissions to create and write to your target CloudWatch log group (e.g., /minikube/tetragon-logs)
- Create an IAM User: Create a new user for programmatic access (e.g., vector-log-shipper) and attach the policy you just created.
- Generate Access Keys: Generate an access key and secret access key for this new user
Next, we need to give Vector permission to write logs to Amazon CloudWatch. For this guide, we'll use a Kubernetes secret to store AWS credentials. First, create a local file named aws_credentials with your key and secret:
[default]
aws_access_key_id = YOUR_AWS_ACCESS_KEY_ID
aws_secret_access_key = YOUR_AWS_SECRET_ACCESS_KEY
aws_credentials
Now, use kubectl to create a secret named aws-credentials in the vector namespace:
# Create the namespace for Vector first
kubectl create namespace vector

# Create the secret from your file
kubectl create secret generic aws-credentials --from-file=credentials=./aws_credentials -n vector
Step 3: Configure the Vector Agent
Now for the core logic. We need to create a configuration file that tells Vector exactly what to do. This file will instruct Vector to find the Tetragon log file, parse its JSON content, and send it to the correct CloudWatch log group. Create a new file named vector-values-cloudwatch.yaml:
role: "Agent"
service:
  enabled: false

# Mount the Tetragon log directory from the host node
extraVolumes:
  - name: tetragon-logs
    hostPath:
      path: /var/run/cilium/tetragon
      type: DirectoryOrCreate
  # Mount the AWS credentials from the Kubernetes secret
  - name: aws-credentials-volume
    secret:
      secretName: aws-credentials

extraVolumeMounts:
  - name: tetragon-logs
    mountPath: /var/run/cilium/tetragon
  - name: aws-credentials-volume
    mountPath: /etc/vector/aws/
    readOnly: true

customConfig:
  data_dir: "/var/run/vector" # Use a standard data directory

  # Source: Read logs from the file Tetragon creates
  sources:
    tetragon_source:
      type: file
      include:
        - /var/run/cilium/tetragon/tetragon.log

  # Transform: Parse the JSON
  transforms:
    tetragon_transform:
      type: remap
      inputs:
        - tetragon_source
      source: |
        # Parse the raw log line as JSON
        . = parse_json!(.message)

        # Add a source/host field for easier filtering in CloudWatch
        for_each(keys!(.)) -> |_index, value| {
          .host = get_env_var!("VECTOR_SELF_NODE_NAME")
          .source = "tetragon"
        }

  # Sink: Send the processed logs to AWS CloudWatch
  sinks:
    cloudwatch_sink:
      type: "aws_cloudwatch_logs"
      inputs:
        - tetragon_transform
      region: "us-east-1"
      group_name: "/minikube/tetragon-logs"
      stream_name: "tetragon-ns-{{`{{ process_exec.process.pod.namespace }}`}}" # Creates a unique log stream for each node
      auth:
        # Use the credentials file mounted from our secret
        credentials_file: /etc/vector/aws/credentials
      encoding:
        codec: "json"
vector-values-cloudwatch.yaml
Step 4: Deploy Vector
With our configuration ready, we can now deploy Vector. We'll use Helm again, pointing it to our custom values file.
# Add the Vector Helm repository
helm repo add vector https://helm.vector.dev/
helm repo update

# Deploy Vector using our configuration file
helm upgrade --install vector vector/vector -n vector -f vector-values-cloudwatch.yaml
This command deploys Vector as a DaemonSet. Each Vector pod will start up, read its configuration, mount the host's log directory, find the tetragon.log file, and begin shipping the data to CloudWatch.
Step 5: Verify the Entire Pipeline
Finally, let's make sure logs are flowing correctly from end to end.
Check the Vector Pods: Run kubectl -n vector logs -f daemonset/vector to see the logs from the Vector agents. You should see logs being processed without errors.
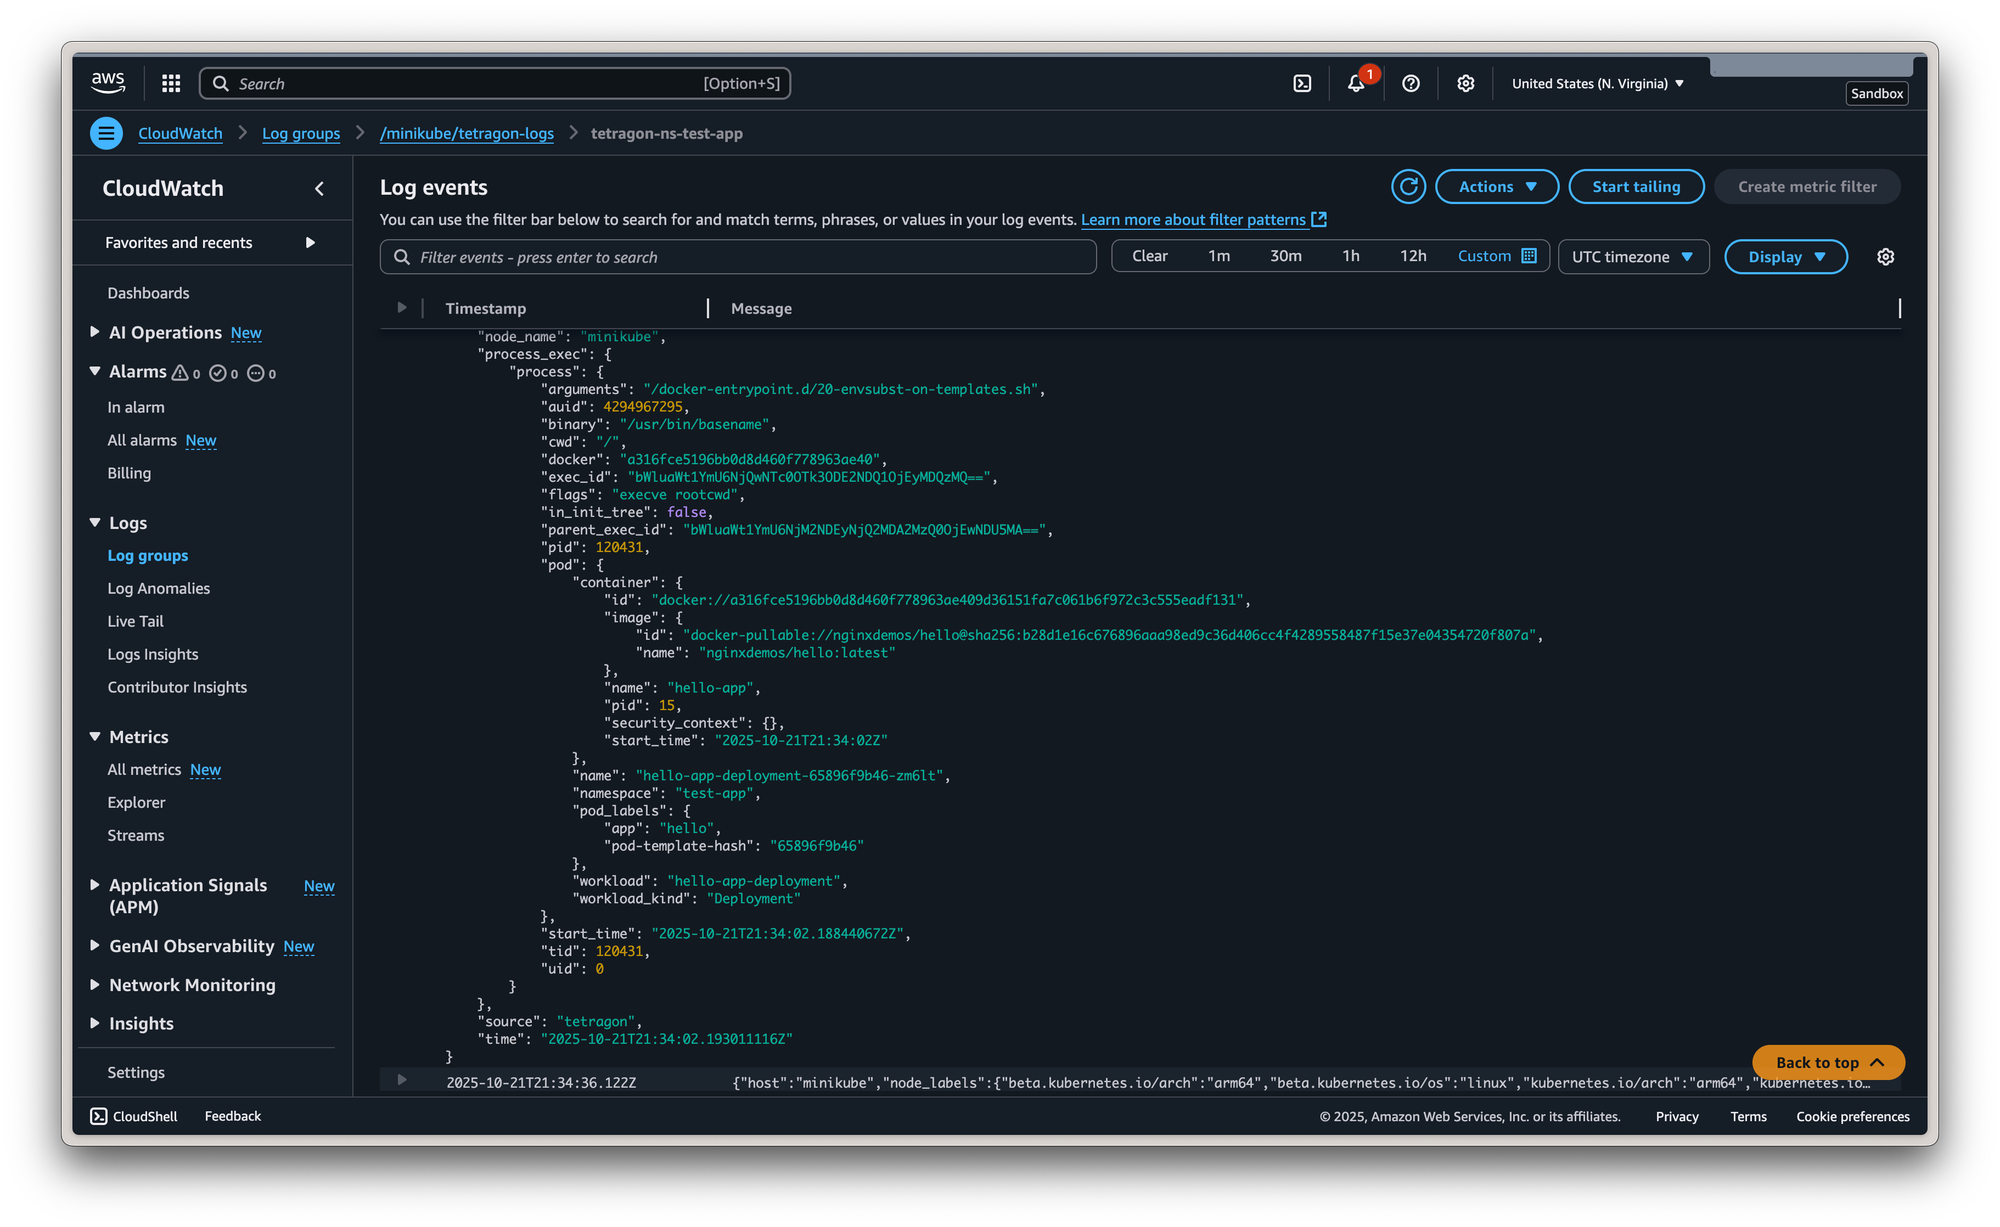
Check CloudWatch: Navigate to the Amazon CloudWatch console in your specified region (us-east-1). You should now see a new log group named /minikube/tetragon-logs. Inside, you'll find log streams containing the structured JSON events from Tetragon.


Member discussion